
The Magic Behind Handling Trillions of Requests: Salesforce’s Observability Platform✨
How Zero-Code Instrumentation and Seamless Integration Power Salesforce’s Trillion-Scale Monitoring

Handling trillions of requests across Salesforce’s vast ecosystem of applications is a commitment to trust, reliability, and performance. At the core of this effort is the observability platform, designed to monitor, diagnose, and resolve issues in real-time. Built with precision, the platform unifies telemetry data, metrics, traces, and events, across programming languages and microservices. This ensures that every engineer, no matter the system they work on, can track and resolve issues efficiently.
The backbone of this platform lies in a team dedicated to creating advanced monitoring agents. By leveraging OpenTelemetry and embracing both auto-instrumentation and zero-code customization, they’ve developed a standardized approach to observability. The result? Faster detection, quicker resolutions, and a scalable solution that meets the demands of one of the most complex technology stacks in the world. This is how Salesforce turns the challenge of managing trillions of requests into an opportunity to uphold its core values and deliver seamless user experiences.
🚀 TL;DR
Salesforce’s observability platform processes 1 trillion transactions monthly. The platform is built with zero-code instrumentation, seamless telemetry integration, and scalable performance all in mind. Features like Deployment Annotations, R.E.D. (Requests, Errors, Duration) Metrics, and Database Insights make troubleshooting a breeze, while keeping everything in-house ensures data security and trust. It’s like monitoring on steroids, but without the performance dips.
OK, So What Are the Requirements? 🤔
To make this magic happen, Salesforce needed:
A Unified Telemetry Format: The observability platform had to handle data from multiple programming languages while keeping it standardized and actionable. OpenTelemetry stepped in to save the day, acting as the translator between all these diverse systems.
Zero-Code Instrumentation: Engineers shouldn’t need to touch app code just to configure monitoring. A simple config file became the hero here, enabling widespread adoption.
Scalability: With 1 trillion transactions, the system has to handle both data generation and deployment across 30,000+ apps.
Enhanced Troubleshooting: Developers needed clear, actionable insights and they need them fast. Features like Deployment Annotations and R.E.D. Metrics provided instant context when things went sideways.
Zero-Code Brilliance & Trillion-Scale Power 💡🚀
🛠️ Zero-Code Instrumentation: No Code, No Problem
Gone are the days of sprinkling monitoring logic throughout your codebase like confetti. With zero-code instrumentation, engineers define telemetry settings in config files. The benefits?
No more app redeploys for simple monitoring tweaks.
Custom R.E.D. metrics straight out of the box.
Simplicity, scalability, and fewer developer headaches.
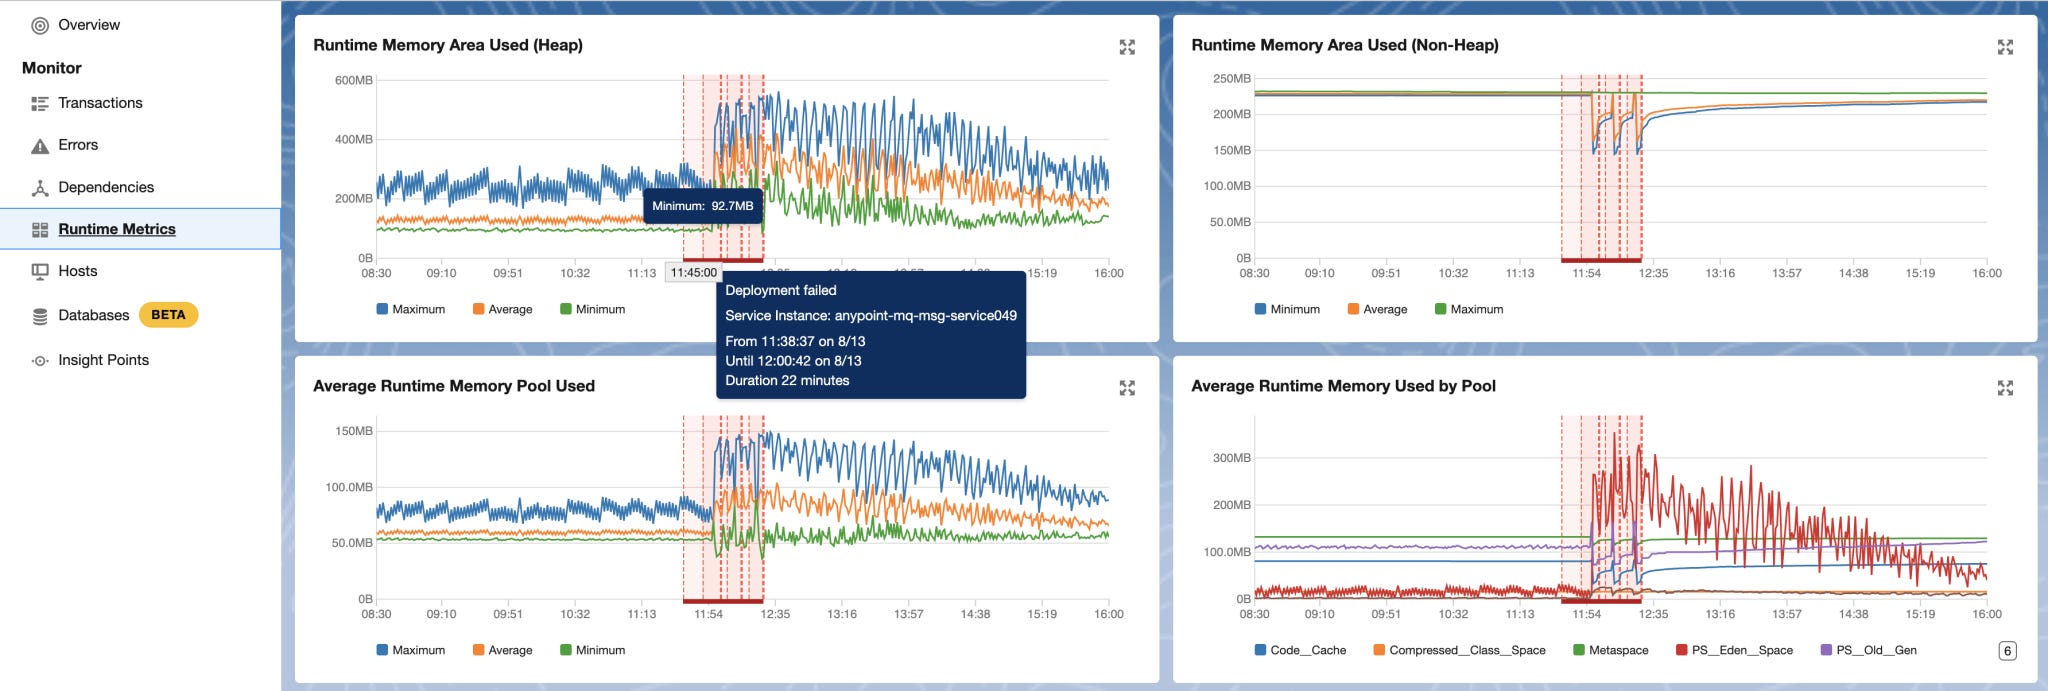
📊 Deployment Annotations: Debugging Like a Pro
Ever deploy an update and wonder, "What just broke?" Salesforce’s Deployment Annotations mark every deployment directly on performance charts. They’re able to instantly correlate spikes in memory usage or latency with specific deployments. No more guesswork, just results.
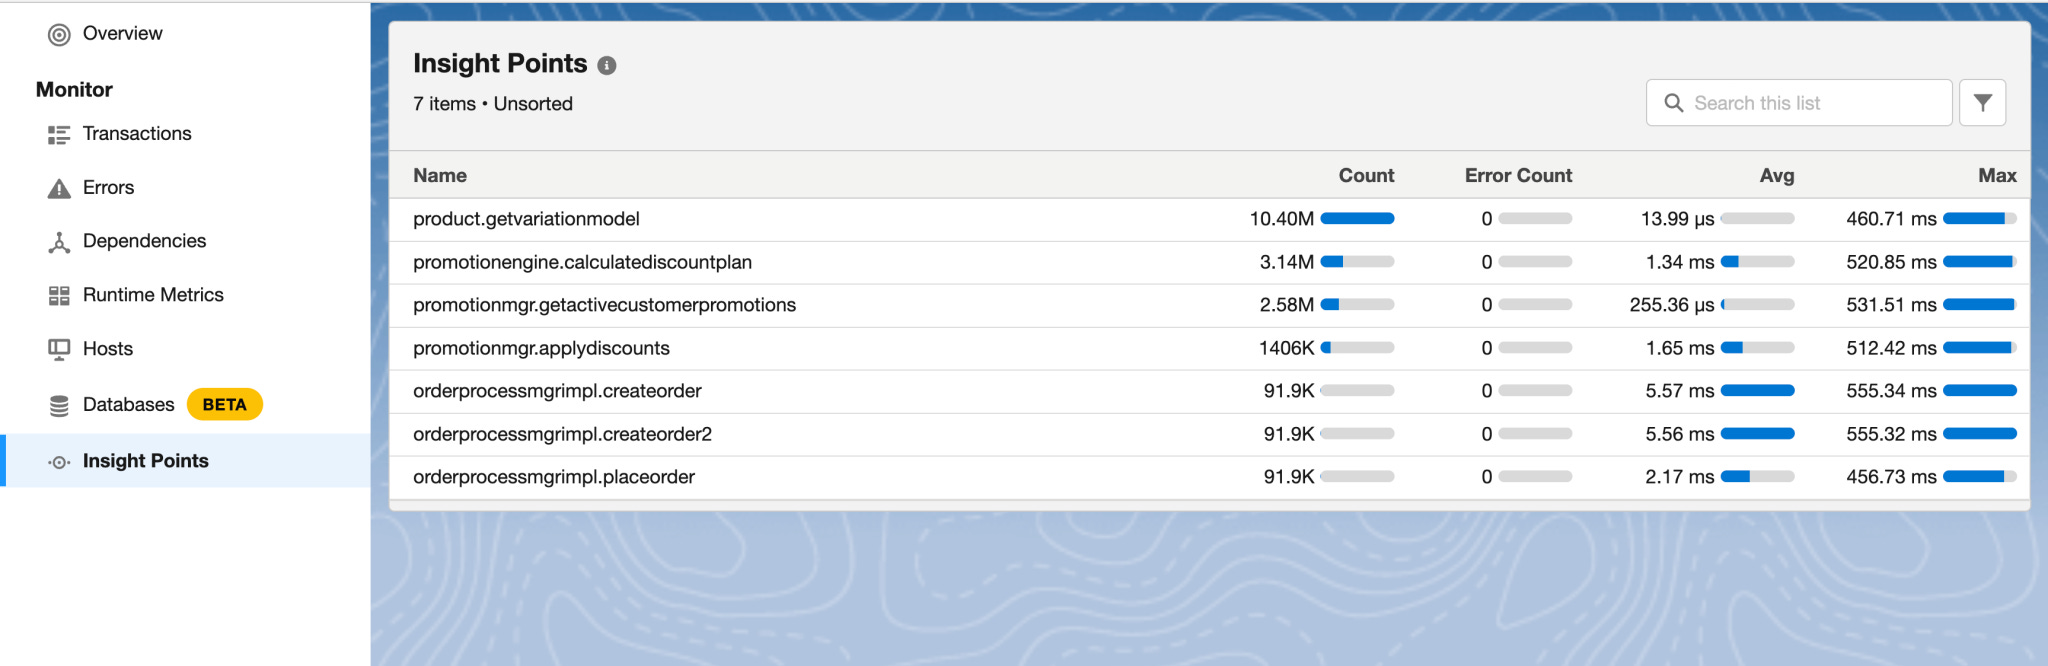
🔍 Insight Points: Deep Metrics, Simplified
For custom telemetry needs, Insight Points generate R.E.D. metrics from specific parts of the app without touching the code. This provides granular visibility into performance hotspots, letting engineers focus on solutions rather than hunting for problems.
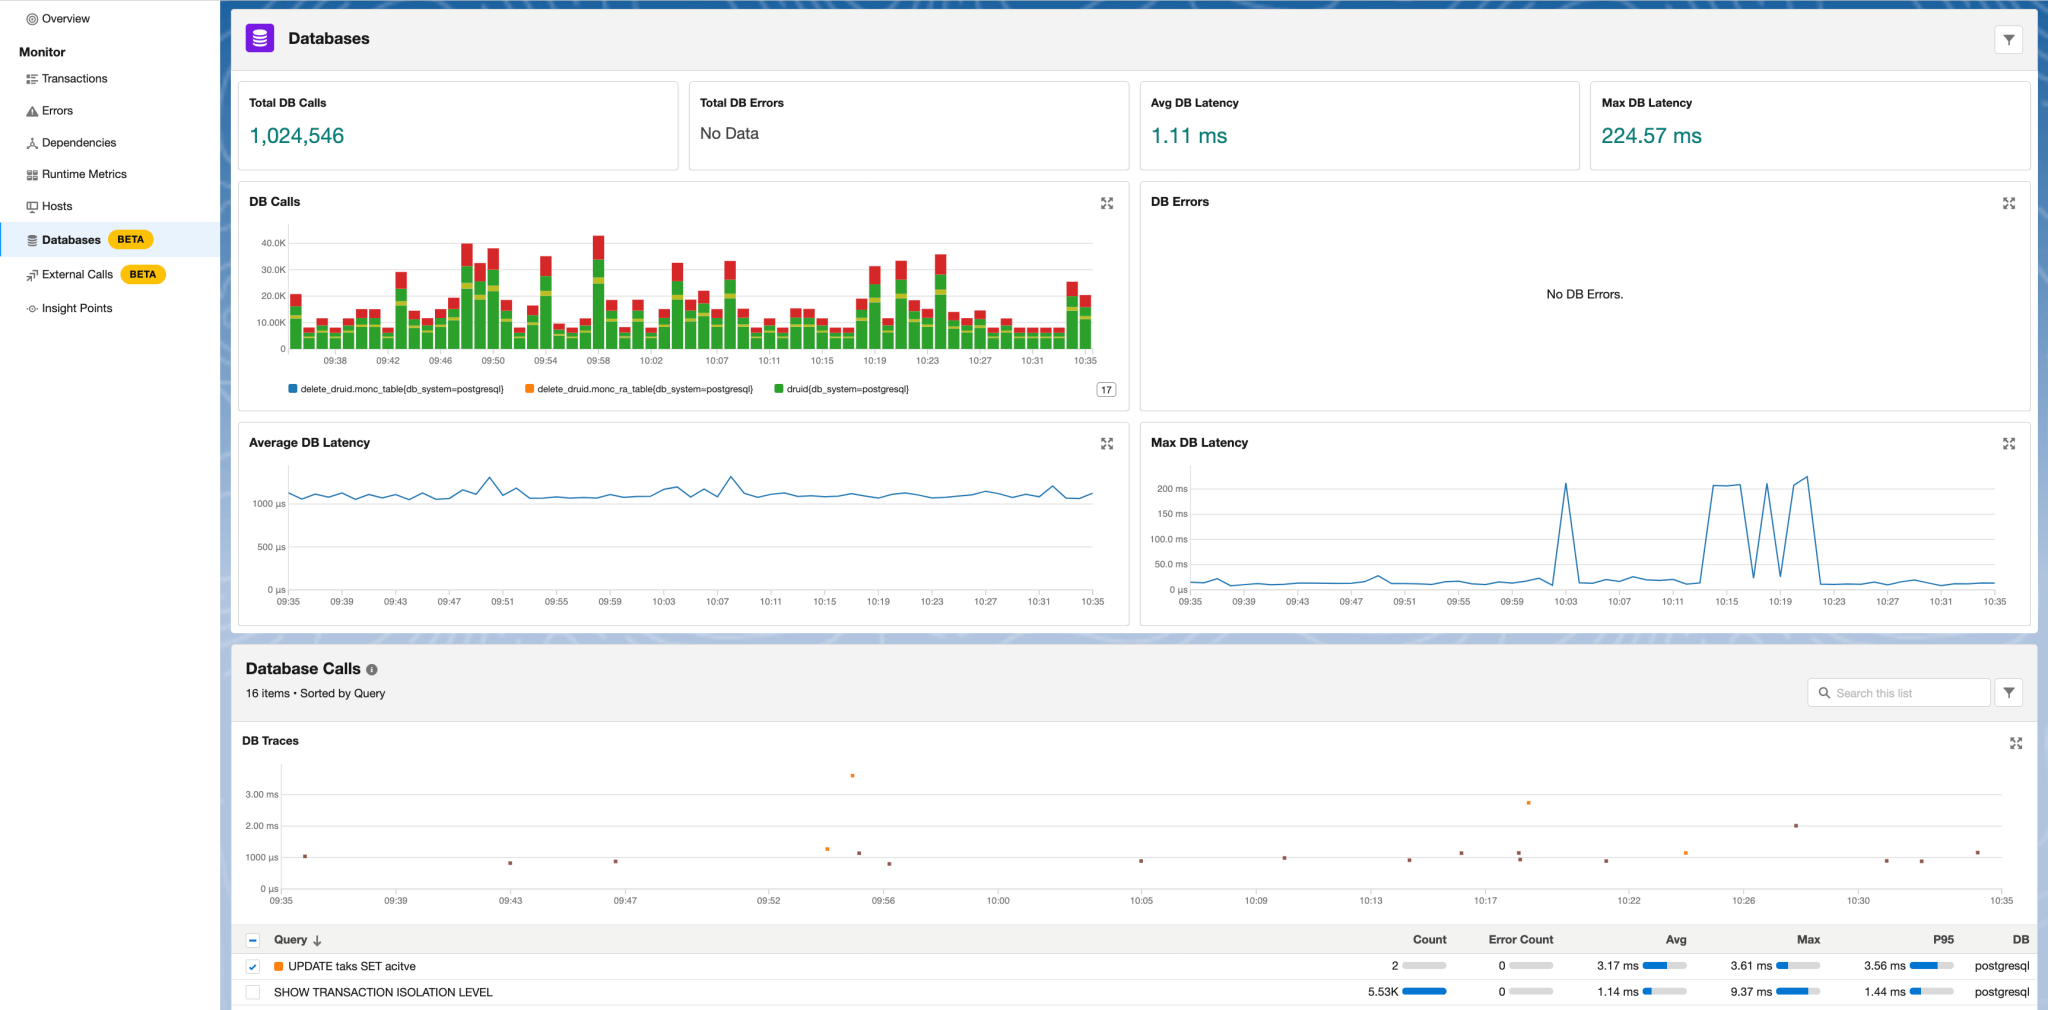
🗃️ Database Monitoring: Exposing the Silent Killers
Slow database queries can cripple performance. Salesforce’s Database Insights digs into query load, latency, and errors, offering visualizations of total calls and performance patterns. Think of it as a CT scan for the backend.
Handling Scale Like a Boss: Deployment & Data Scalability 🌍💾
📦 Deployment Scalability
APM (Application Performance Monitoring) agents run across 30,000+ apps in diverse environments (VMs, Kubernetes, first-party hosts).
Rigorous testing frameworks, including performance and integration tests, ensure stability under heavy workloads.
Trusted pipelines with canary releases and staggered deployments make rollouts safe and controlled.
📈 Data Scalability
Agents prioritize critical anomalies, avoiding user overwhelm with redundant data.
Short-lived traces help pinpoint immediate issues, while aggregated metrics reveal early warning signs of larger problems.
Metrics, traces, and events are seamlessly interwoven for a holistic view.
Why Build In-House? 🏰🔒
Keeping telemetry data within Salesforce isn’t just about control, it’s about trust. By developing their own platform:
Data remains secure, avoiding exposure to third-party vulnerabilities.
Engineers get deeper integration with Salesforce tools, like Data Cloud and Agentforce.
AI/ML enhancements enable smarter insights and predictive monitoring without sacrificing privacy.
Too Long: Did Read 🙌
Salesforce’s observability platform is a masterclass in monitoring:
Zero-code instrumentation makes adoption easy and scalable.
Deployment Annotations and Insight Points simplify troubleshooting.
Database Monitoring ensures backend bottlenecks don’t go unnoticed.
In-house development keeps telemetry data secure and fully integrated with Salesforce systems.
The result? Faster issue resolution, smarter insights, and a monitoring platform ready to handle a trillion transactions—and beyond. 🔥
🔔Follow Us for More!
Want daily, byte-sized system design tips to level up your skills? Follow us on LinkedIn and Twitter for insights that make complex concepts simple and actionable!
🎉 SPONSOR US 🎉
Promote your product or service to over 30,000 tech professionals! Our newsletter connects you directly with software engineers in the industry building new things every day!
Secure Your Spot Now! Don’t miss your chance to reach this key audience. Email us at bytesizeddesigninfo@gmail.com to reserve your space today!
Or get in touch from our storefront on Passionfroot!
❓ Quiz Questions, Answers, and Official Article
What was the most significant technical challenge faced by the observability team recently?
Keep reading with a 7-day free trial
Subscribe to Byte-Sized Design to keep reading this post and get 7 days of free access to the full post archives.