
When Your ML Training Grinds to a Halt: Pinterest’s Wild Bug Hunt
How a 50% performance drop led engineers from PyTorch to page tables

You upgraded PyTorch. Your training throughput just tanked 50%.
Welcome to hell.
This is Pinterest’s story of debugging one of those issues that makes senior engineers question their life choices—the kind where every theory gets shattered, every tool lies to you, and the culprit is something nobody suspected.
Buckle up.
🎯 The Setup: Not Your Average Training Stack
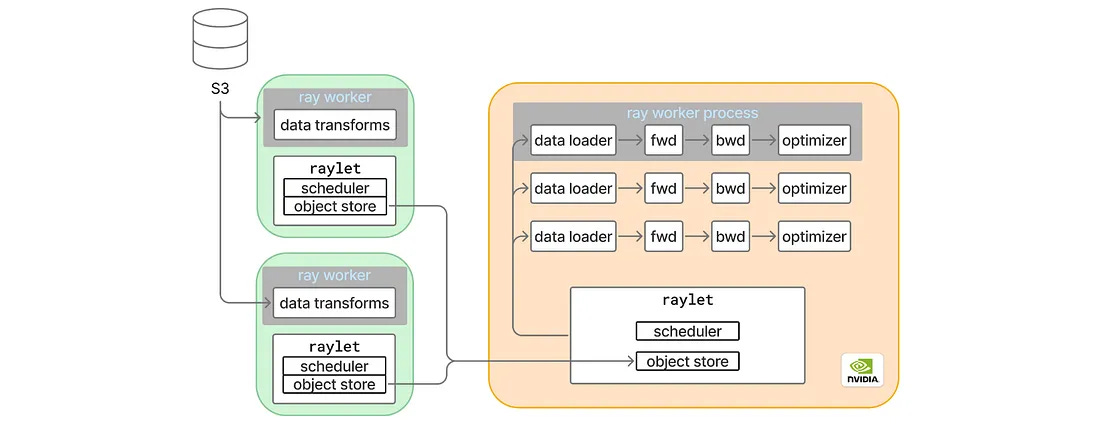
Pinterest’s MLEnv isn’t just PyTorch with some configs. These folks built a beast:
Ray for horizontal data loading 💪: CPU workers handle transforms remotely, keeping the main process lean.
Distributed data parallel 🌐: Multiple GPU ranks syncing via NCCL.
torch.compile ⚡: Because who doesn’t want free speedups from optimized kernels?
The upgrade should’ve been routine. New PyTorch version, update some deps, ship it.
Instead? Training examples per second dropped in half.
Oh no.
🐛 Bug #1: The Disappearing Compiler
First move: measure GPU roofline throughput—basically “how fast can we go if we ignore data loading completely?”
Even there, 20% drop. The data loader isn’t even in the picture and things are already on fire.
So the team starts playing Jenga with their model, pulling modules out one by one. Eventually they isolate one of their beefy transformer modules. But here’s the weird part—when they peek at the PyTorch profiler, the CompiledFunction traces are just... gone.
Like a magic trick, except nobody’s clapping.
They turn off torch.compile and suddenly both versions run at the same speed. So compilation is broken?
Not quite. The logs show compilation succeeded, but with this absolute gem of a warning:
skipping: non-infra torch dispatch mode presentAh yes, that clears everything up. Thanks, PyTorch.
Time to build minimal repros. Three of them:
Just the module → works fine
Simple model with only that module → works fine
Full trainer class → compilation vanishes into the void
The trainer is the problem. But what in the trainer?
After more surgical code removal than a medical drama, they find it—a context manager wrapping every forward/backward pass:
python
with FlopCountMode():
    # training happens here
This PyTorch dispatch mode, lovingly added by the infra team to track FLOPs, is absolutely murdering compilation in the new version. Disable it, and boom—CompiledFunction is back from the dead.
Problem solved?
Narrator: It was not solved.
End-to-end throughput still sucks.
🎭 Bug #2: The Three-Second Mystery
Now for the real fun. Buckle up for a series of observations that’ll make you want to flip your desk:
Every ~3 seconds, one iteration crawls 🐌: Regular iterations purring along, then BAM—one takes forever.
Round-robin stragglers 🔄: At sync points, different GPU ranks take turns being slow. It’s like they’re playing hot potato with performance issues. “Your turn to be slow!” “No, YOUR turn!”
Random Python functions freeze 🥶: Not compute-heavy code. Not anything expensive. Just... random everyday Python stuff decides to take a nap.
Nsight profiler makes it disappear 🎩✨: Enable the profiler? Problem gone. Disable it? Problem back. The Heisenbug of Heisenbugs.
That last one? Chef’s kiss levels of “what the actual hell.”
🕵️ The Investigation That Went Nowhere (Fast)
The team starts chasing theories like a detective novel where every suspect has an alibi:
Global Interpreter Lock? Maybe some C++ extension isn’t releasing the GIL properly, strangling the main thread. But PyTorch profiler doesn’t capture GIL events, and Nsight is actively gaslighting them by making the problem disappear.
Ray timers? They grep the entire codebase for 3-second timers. Find some. Change them. Run the tests. Nothing. Zip. Nada.
Distributed training shenanigans? They try a single GPU. Problem’s still there, mocking them.
At this point, someone’s probably stress-eating chips at their desk.
Then a pattern emerges: modules with the most graph breaks cause the worst slowdowns.
Interesting. They build a minimal model that artificially explodes graph breaks—like setting off fireworks in a library. Now they can iterate without waiting hours between theories.
💡 The Breakthrough: When perf Tells the Truth
New observations with their Frankenstein minimal model:
Regular iterations: 5ms ✅
Slow iterations: 25ms 😬
Occasional 500ms monsters (turns out to be garbage collection—a red herring, but terrifying to watch)
Nsight still makes it better (12ms regular, 19ms slow)
Nsight traces show the thread holding the GIL during pauses. So not lock contention. But CPU’s at 100%, spinning its wheels, going absolutely nowhere.
Wait a second.
What if the problem isn’t this process at all?
Plot twist time.
They fire up perf with -a to capture every single process on the machine. Collect a 4-second trace (enough to catch the 3-second pattern), and now they need to visualize it.
Flamegraphs? Those aggregate everything—completely useless for finding 6ms pauses in seconds of data across dozens of processes. They need time series. Chrome tracing format would be perfect. Conversion tool?
Doesn’t exist.
So they do what any modern engineer does: ask an LLM to write one.
Few manual tweaks later (because of course), and they’ve got their trace beautifully visualized in chrome://tracing.
🎯 The Smoking Gun
Scrolling through the timeline, they spot something suspicious. A Python process doing something expensive at regular intervals.
The callstack shows smap_gather_stats—a Linux kernel call that walks through process memory to collect stats.
It’s happening every 3 seconds.
It locks the page table while it works.
The training process has to wait for the lock to release.
There you are, you little bastard.
They grab the PID, hop over to the terminal, run ps aux | grep <pid>, and...
Ray’s monitoring agent 👀
Specifically, ray/dashboard/agent.py, cheerfully reporting worker memory stats using psutil.memory_full_info() every 2.5 seconds like it’s doing everyone a favor. That call triggers the kernel walk, locking page tables while it collects “detailed” memory info nobody asked for.
🧩 Why Everything Suddenly Makes Perfect Sense
3-second intervals? Actually 2.5s—the monitoring schedule. Close enough that grepping for “3” missed it entirely.
Round-robin effect? The agent loops through workers sequentially in a for loop. Each iteration, a different rank gets hit. Taking turns like kindergarteners.
Random Python functions freezing? Not frozen—waiting for the page table lock to release. Just wrong place, wrong time.
Nsight fixes it? When you wrap training with Nsight, the nsys wrapper becomes the child process instead of the Python trainer. Way less memory = way faster stats collection = no problem. The profiler wasn’t lying—it was accidentally fixing the bug by changing the process tree.
Mind. Blown.
🎉 The Fix: Sometimes the Best Code is Deleted Code
Pinterest takes a hard look at their Ray dashboard. Do they really need detailed memory stats in everyday training runs?
Nope.
They rip out memory_full_info() from their custom Ray build.
Result? Instead of a 50% drop, they get a 20% speedup.
2.4x swing from finding two bugs. Not bad for a few weeks of debugging hell.
