
How Lyft Gets Driver Arrival Time Right (Almost) Every Time 🚗📍
How data and machine learning keep you on schedule.

📚 Before we Jump in!
We’d love to hear from you! What system design topic would you like us to explore next week? Let us know and we’ll dive into the one that sparks the most interest! 📊
🚀 TL;DR
Lyft turned the chaos of driver ETA (Estimated Time of Arrival) predictions into a science. By using real-time traffic data, historical trends, and cutting-edge machine learning, they’ve made ETAs more reliable—even in unpredictable conditions. Here’s how they did it and what we can learn. 🚗💨
✅ OK, Tell Me the Requirements
Before Lyft could tackle the ETA problem, they had to define what reliable really means. Here’s what they came up with:
Reliability Across Ride Phases:
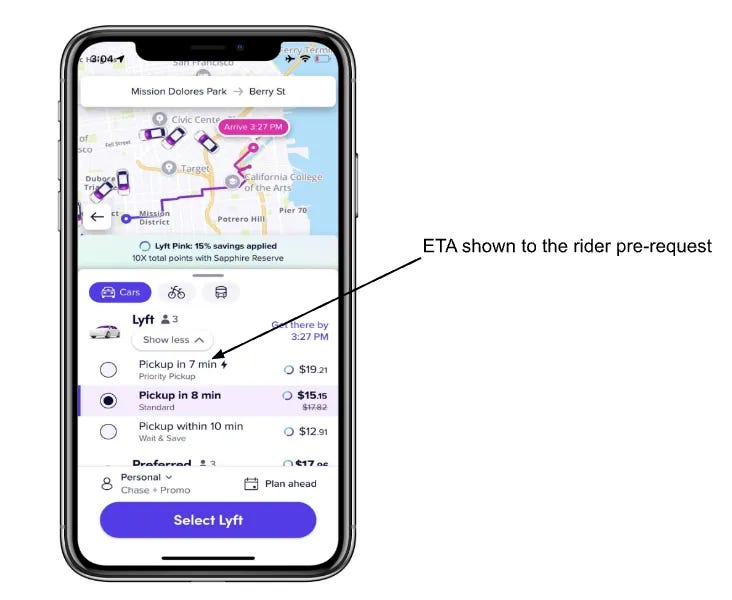
Pre-Request: Before a rider even hits “Request,” the ETA shown must accurately reflect the likelihood that a driver will arrive within the promised window.
Post-Request: Once the rider matches with a driver, the ETA must track real-time changes, like traffic or driver detours.
Low Cancellation Rates:
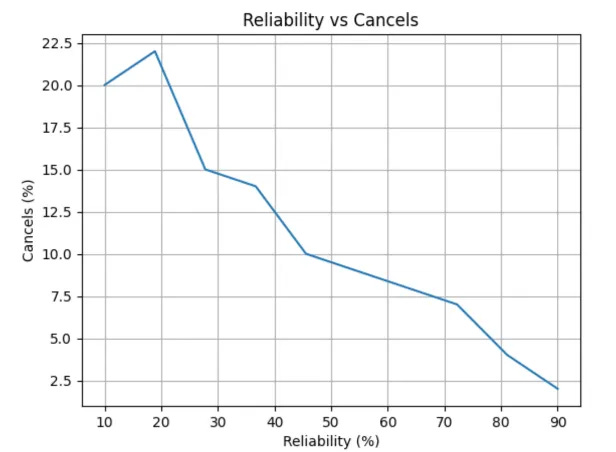
ETAs must balance speed and reliability to reduce cancellations. If the system overpromises (e.g., says five minutes but takes 15), riders cancel (Reliability vs. Cancels graph below).
🛑 Why ETAs Are Hard: Traffic, Humans, and Chaos
Let’s be honest, Nobody likes waiting, especially when they were told five minutes but it’s actually fifteen. Lyft knows this frustration and solving it is much harder than it looks.
The thing about ETAs is that they’re messy, unpredictable, and affected by everything:
Traffic Changes: A car accident two miles away can derail your ETA in seconds.
Human Behavior: Drivers take detours, stop for coffee, or slow down unexpectedly. Riders linger at the curb.
Environmental Factors: Bad weather and construction throw a wrench into predictions.
Marketplace Surges: After a concert, everyone wants a ride NOW, and the demand crushes accuracy.
Sparse Data: Some routes (looking at you, small-town Wyoming) have so little historical data that predictions become guesswork.
Despite all this, Lyft didn’t give up. Instead, they engineered a system that blends real-time traffic with historical patterns to tackle uncertainty head-on.
⚡ How Lyft Balances Real-Time Data with Historical Trends
Lyft’s ETA engine is like a hybrid brain: part instinct, part memory. Here’s how it works:
Real-Time Data: Responding to the Now
The Router Service takes live traffic feeds and identifies the fastest routes based on current conditions. Think road closures, traffic jams, or an unexpected parade.Historical Data: Learning from the Past
The Predictor Service looks at trends over months or years. It knows:Weekday rush hours create predictable slowdowns.
Concert venues have traffic spikes at 11 PM.
School zones crawl at pickup time.
The Blend: A Match Made in Traffic Heaven
Lyft’s models combine real-time updates with historical context. Real-time keeps predictions reactive, while historical trends prevent overcorrection and stabilize the system.
🔄 Why Lyft Split ETA Computation into Two Services
Lyft didn’t put all its eggs in one basket. Instead, they split the system into two services:
Router Service: Handles the immediate task of calculating routes with real-time data.
Predictor Service: Refines these estimates using historical data and machine learning.
Why the Split?
Specialization: Each service focuses on one task, making it easier to optimize.
Scalability: The Router Service can scale to handle ride spikes, while the Predictor Service scales independently for data processing.
Fault Tolerance: If one service hiccups, the other keeps things running.
Easier Maintenance: Engineers can iterate on one service without breaking the other.
This modular design isn’t just smart—it’s necessary when you’re running millions of ETA requests daily.
🧠 Features and Training: Predicting the Unpredictable
Lyft’s system is a data lover’s dream, pulling in insights from multiple angles.
Key Features Lyft Uses:
Nearby Drivers:
The model examines drivers closest to the ride request—looking at their status, estimated arrival times, and distances to predict availability.Historical Benchmarks:
Historical data at the regional and geohash levels captures long-term trends, like average match times or cancellation rates.Marketplace Features:
Demand-supply indicators, such as app opens or unassigned rides in a neighborhood, show real-time market conditions.Location and Context:
Pickup and drop-off locations, time of day, and categorical data like city versus suburb play a role.
How Lyft Trains Its Models:
Lyft uses an innovative training approach that flips traditional methods on their head:
Binary Labels for Reliability:
The system compares actual driver arrival times against predicted ETAs to determine reliability.Training on All Possibilities:
Instead of training on the one ETA shown to riders, the system trains on all possible ETA estimates. Why?Avoids feedback loops where the model trains itself into a rut.
Ensures all ETA scenarios are represented.
Evaluating Performance:
The model uses the Area Under the Curve (AUC) metric for evaluation. AUC is ideal because it measures performance across all thresholds, not just one.
🤖 The Role of Machine Learning
ML is Lyft’s secret weapon for taming ETA chaos:
Recognizing Patterns:
ML analyzes massive datasets to uncover trends—like the likelihood of traffic bottlenecks during specific times or in certain areas.Adapting in Real Time:
As new traffic and rider data flows in, the model recalibrates ETAs dynamically.Edge Case Management:
ML fills in gaps where historical data is sparse or real-time feeds are unreliable.Continuous Learning:
Feedback loops refine the model, ensuring predictions get better over time.Personalization:
Models adapt to specific behaviors, like drivers who tend to deviate from routes or riders who take extra time to board.
Too Long, Did Read 🚀
Lyft’s ETA predictions are powered by real-time traffic updates, historical data, and machine learning to tackle the chaos of driver availability, traffic, and marketplace dynamics. Their modular system design ensures scalability and resilience, while training models on all possible scenarios prevents inaccuracies from creeping in. It’s not magic, but smart engineering that keeps your ride’s arrival time reliable, getting there on time, almost every time. 🚗✨
🔔Follow Us for More!
Want daily, byte-sized system design tips to level up your skills? Follow us on LinkedIn and Twitter for insights that make complex concepts simple and actionable!
📚 Great Reads of the Week
Thank you so much for reading this edition of the newsletter. If you found it interesting, you will also enjoy these great posts of the week!
5 Frameworks to Master Communication and Influence As An Engineer By Jordan Cutler
No More Redundant Engineering Debates: Creating Alignment and Clarity with ADRs by Fran Soto
Discipline Over Motivation in the Engineering Industry by Gregor Ojstersek
🎉 SPONSOR US 🎉
Promote your product or service to over 30,000 tech professionals! Our newsletter connects you directly with software engineers in the industry building new things every day!
Secure Your Spot Now! Don’t miss your chance to reach this key audience. Email us at bytesizeddesigninfo@gmail.com to reserve your space today!
Or get in touch from our storefront on Passionfroot!
❓ Quiz Questions, Answers, and Official Article
The official article dives into these questions in depth (Below you’ll find the answers for paid subscribers)
What features does Lyft use to account for marketplace uncertainty in ETA predictions?
Why does Lyft train on all possible ETA estimates instead of just factual ones?
How does the training process avoid negative feedback loops?
What is the significance of AUC as an evaluation metric for ETAs?
How do neighborhood-level demand and supply features enhance predictions?
How does Lyft maintain the performance of their models over time in the dynamic rideshare environment?
Answers to Questions:
Keep reading with a 7-day free trial
Subscribe to Byte-Sized Design to keep reading this post and get 7 days of free access to the full post archives.